Smart-ABI Plus — Vascular Assessment
Arterial pressure, volume plethysmography, vasomotion, and index trends
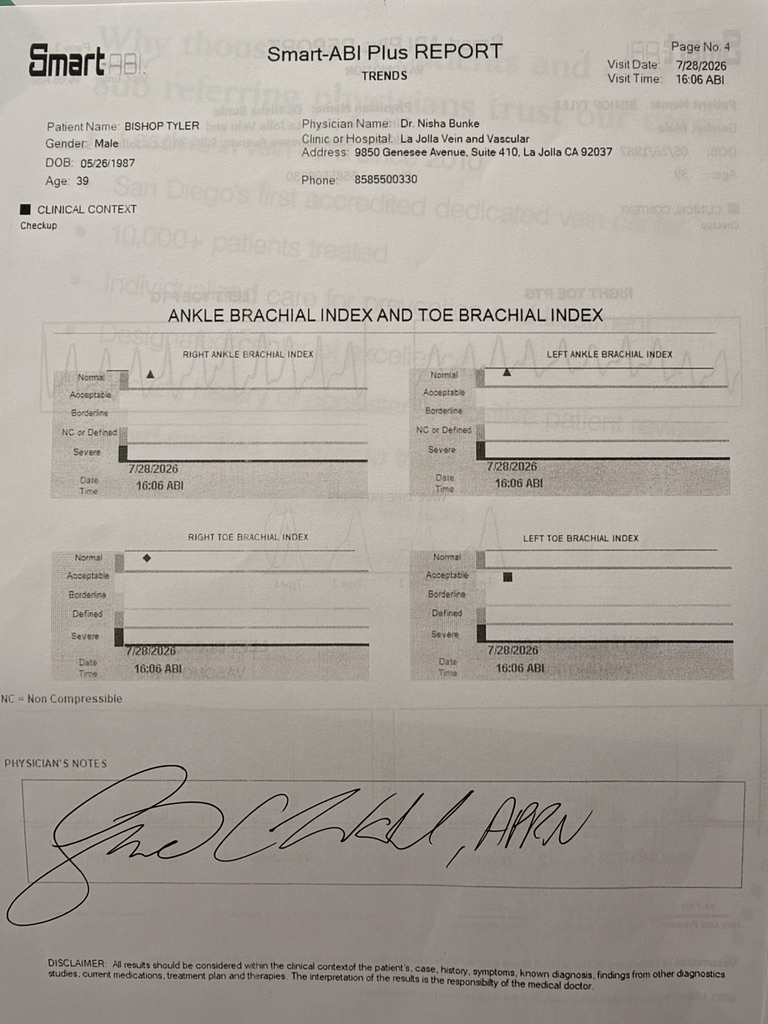
Page 1 — Vascular assessment
| Measurement | Right | Left |
|---|---|---|
| Ankle brachial index (ABI) | 1.10 | 1.18 |
| Arm systolic pressure (mmHg) | 125 | 134 |
| Arm diastolic pressure (mmHg) | 89 | 80 |
| Posterior tibial artery systolic pressure (mmHg) | 144 | 153 |
| Dorsalis pedis artery systolic pressure (mmHg) | 148 | 158 |
| Toe brachial index (TBI) | 0.66 | No numeric value legible in supplied image |
| Toe systolic pressure (mmHg) | 88 | 84 |
| Toe SpO2 (%) | 99 | 99 |
| Toe PI (%) | 0.7 | 0.4 |
| Vasomotion (PTGi), mV/min | 42 | 38 |
Sum of Brachial Indices (SBI): 1.74.
Printed PAD chart text: “NORMAL BLOOD FLOW AND NO ATHEROSCLEROSIS PLAQUE RISK DETECTED.” This is the device report wording, not an independent conclusion about the cause of swelling or an exclusion of all vascular disease.
Printed comparison notes: ABI compared to Color Doppler ultrasound: specificity and sensitivity 77.8%. TBI comparison: specificity 55.6% and sensitivity 100%. SBI comparison: specificity 88.9% and sensitivity 100%; the report says that algorithm cannot be used when ABI is ≥ 1.40.
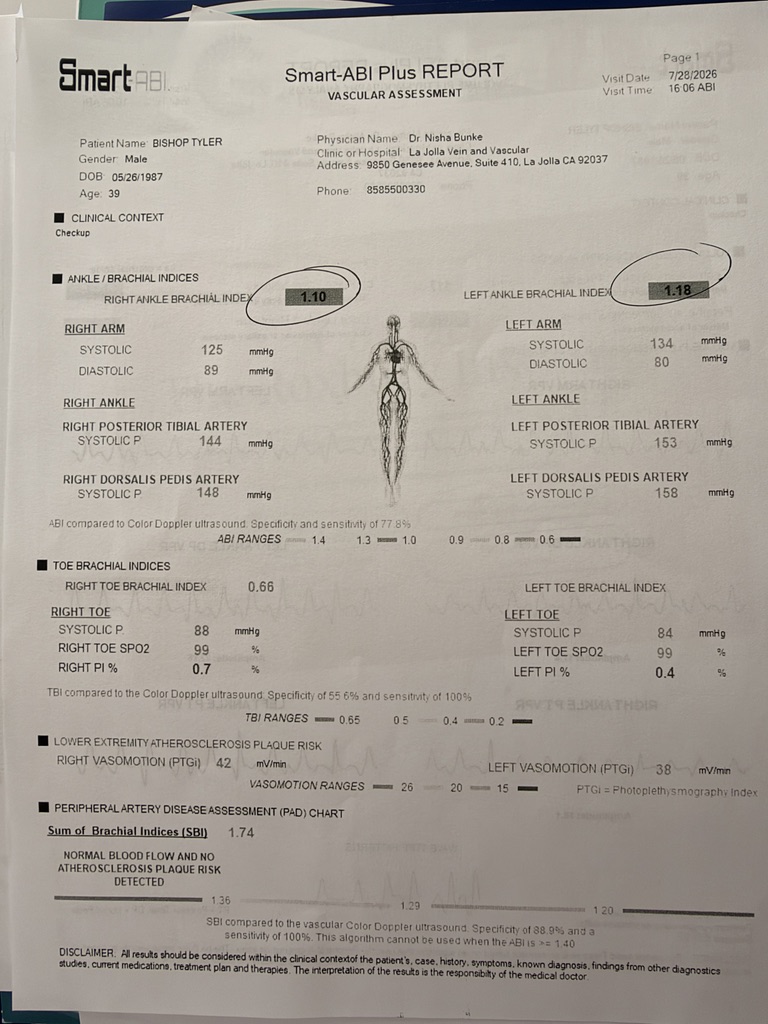
Page 2 — Volume plethysmography analysis
| Measurement | Value | Printed description |
|---|---|---|
| Central aortic systolic pressure | 117 mmHg | Marker of the pressure at the aorta |
| Peripheral augmentation index | 69% | Marker of aortic stiffness |
| Brachial-ankle pulse wave velocity | 956 cm/s | Marker of lower extremity arterial stiffness |
| Delta left and right arm | 9% | Marker of subclavian or axillary stenosis |
| Recording | Right | Left |
|---|---|---|
| Ankle dorsalis pedis (DP) | 17.8 | 22.76 |
| Ankle posterior tibial (PT) | 18.1 | 26.73 |
The page shows six waveform traces: right and left arm VPR, right and left ankle DP VPR, and right and left ankle PT VPR, plus wave-type pattern examples. No numeric arm amplitude or ankle amplitude unit is printed. The normal/borderline/abnormal shading is not reliably distinguishable in the photograph; no status is assigned here.
Method: Volume plethysmography using air pressure cuffs. The printed disclaimer describes central aortic pressure and pulse wave velocity as estimates derived by an algorithm, with graphic interpretation the responsibility of the medical doctor.
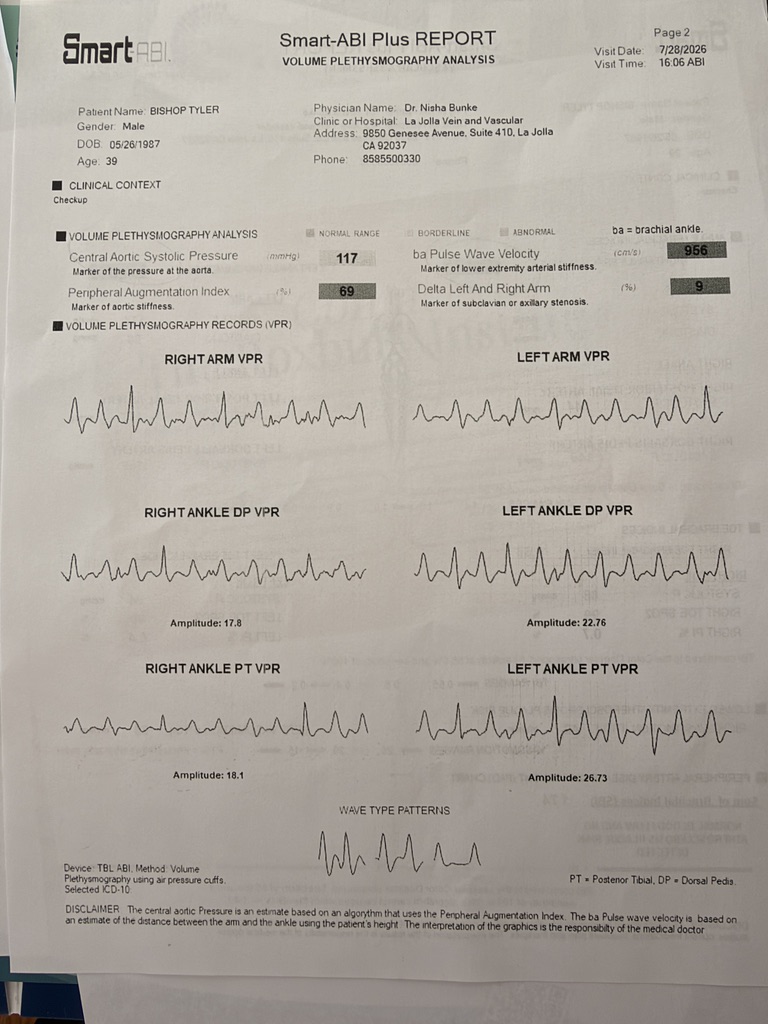
Page 3 — Vasomotion
Right vasomotion: 42 mV/min. Left vasomotion: 38 mV/min.
The source contains right and left toe photoplethysmography (PTG) traces, four reference wave-type patterns labeled Type 1–4, and right and left blood-flow vasomotion frequency plots. The plots mark 2.2, 3.66, and 7.33 Hz. Reference bands are labeled very low frequency (<1.1 Hz), low frequency (1.1–2.2 Hz), and high frequency (>2.2 Hz). No patient-specific wave-type classification is stated in text.
Printed note: “Vasomotion is correlated to the arterial blood flow as shown in the studies of vasomotion and in our clinical studies.” The report assigns interpretation of the graphics to the medical doctor.
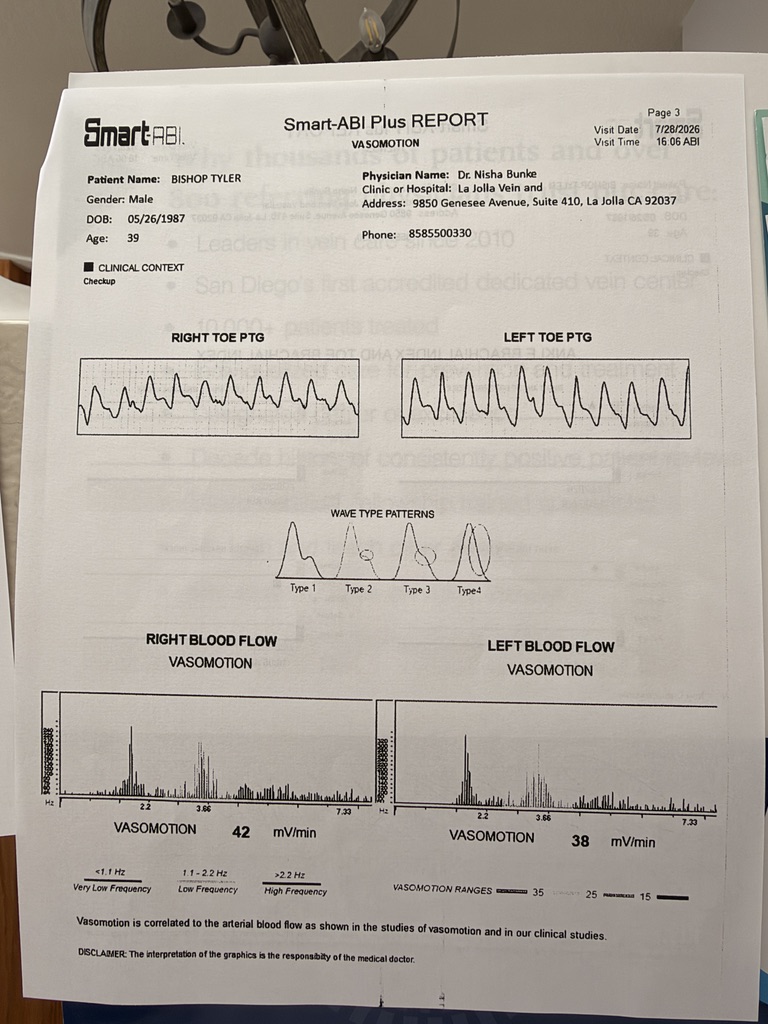
Page 4 — Trends and signature
The “Ankle Brachial Index and Toe Brachial Index” page shows four plots with one visit each: July 28, 2026, 16:06. Both ABI markers and the right TBI marker appear in the printed “Normal” band; the left TBI marker appears in “Acceptable.” These are descriptions of the device chart labels, not independently assigned clinical interpretations. No additional numeric index values are printed here and no longitudinal series is shown.
The physician’s notes box contains a handwritten signature with “APRN” legible; the signer’s name is not confidently readable. No separate narrative assessment is legible in that box.